
SYS 0.1
AI Chart Canvasing
Prompt AI to map weekly support shelves, Volume Profile Point of Control, and Fair Value Gaps directly onto live charts before risking capital.
Prompt AI to plot weekly support, Fair Value Gaps, and Volume Profile levels straight onto live candlesticks—then document every trade record alongside separate Portfolio Books for spot, futures, and defensive reserve assets.
SolutionsSee what Striv solves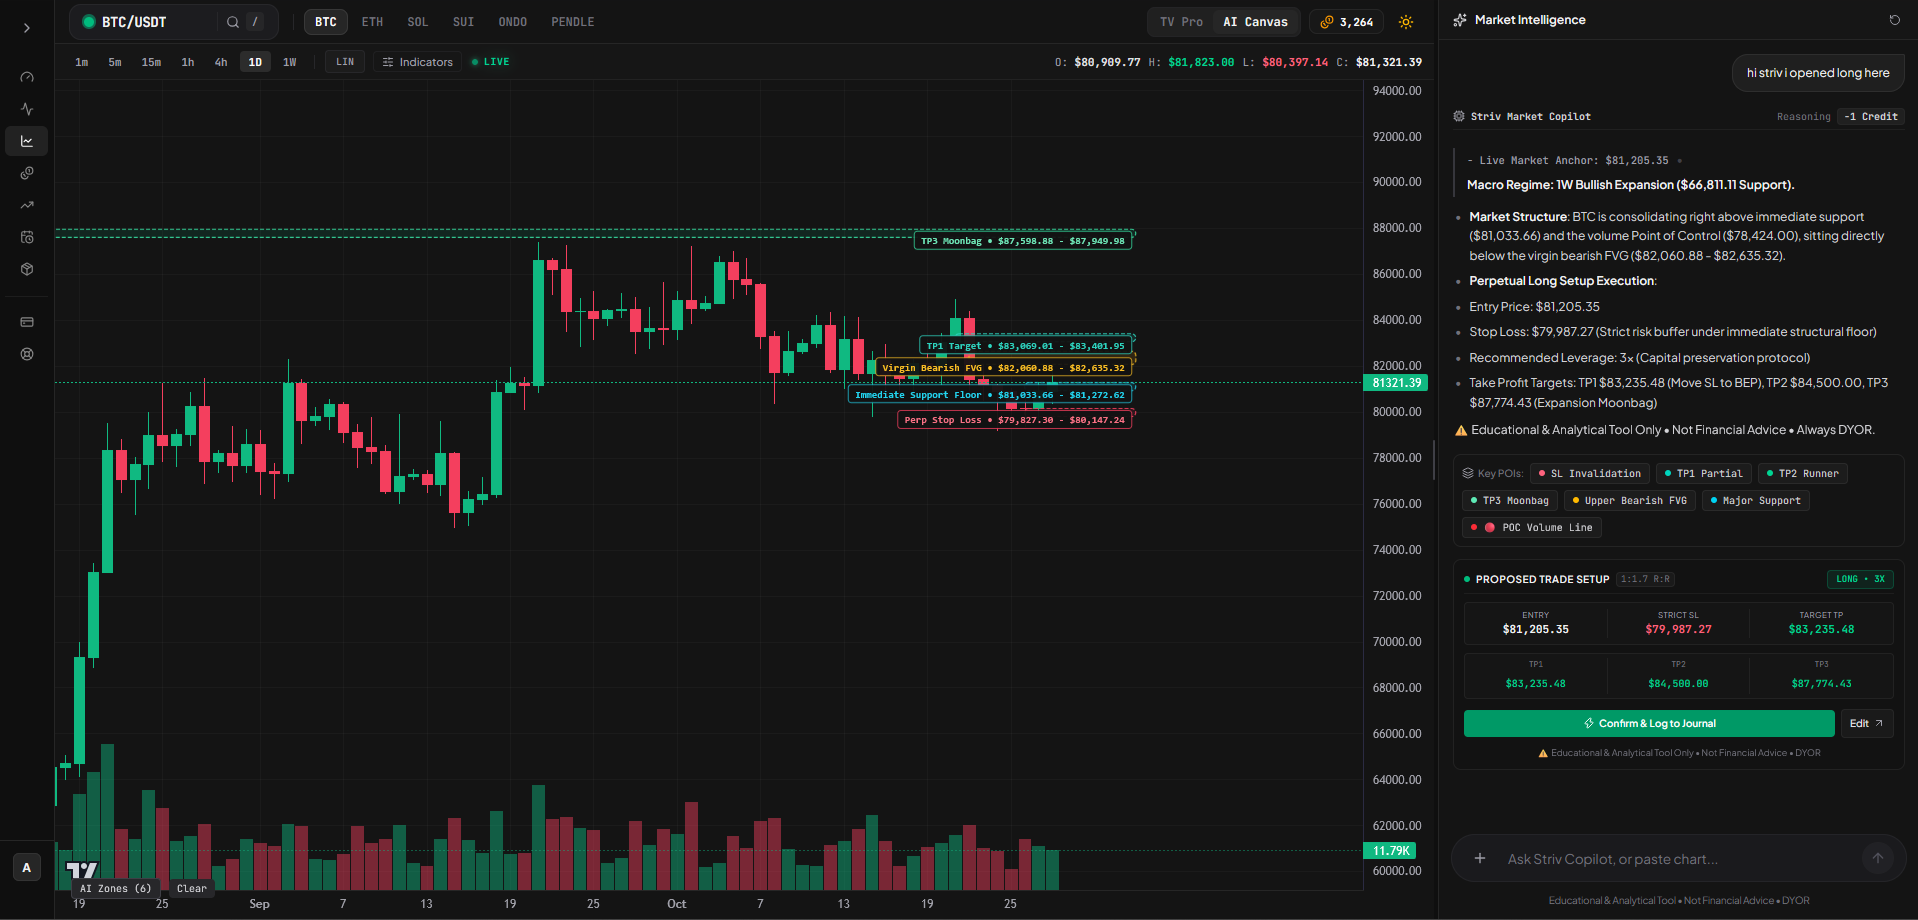
Market conditions change. Your notes preserve what you knew at the time, so a later review can examine the decision as well as the outcome.
Prompt AI to map weekly support shelves, Volume Profile Point of Control, and Fair Value Gaps directly onto live charts before risking capital.
Separate spot holdings, futures books, and defensive reserves so Copilot always reviews risk against accurate ledger totals.
Turn every chart canvas into a verified journal record with entry reasoning, fee-adjusted returns, and clear invalidation levels.
Connect weekly price structure, scheduled economic releases, and your recorded spot or futures positions so every review stays grounded in context.
Explore market toolsBTC/USDT is holding above the $81,033 weekly support floor and the volume Point of Control ($78,424).
Unfilled bearish Fair Value Gap sits overhead between $82,040 and $82,635. Watching for displacement before adding size.
Structural invalidation remains fixed at $79,987 under the prior weekly wick low.
@Copilotmap weekly FVG levels against my active BTC setup
AI Chart Canvas plots live support, supply zones, and clear invalidation and target geometry directly onto candlesticks. Log any review in one click so your original thesis stays tied to the outcome.
Inspect journal & portfolio solutions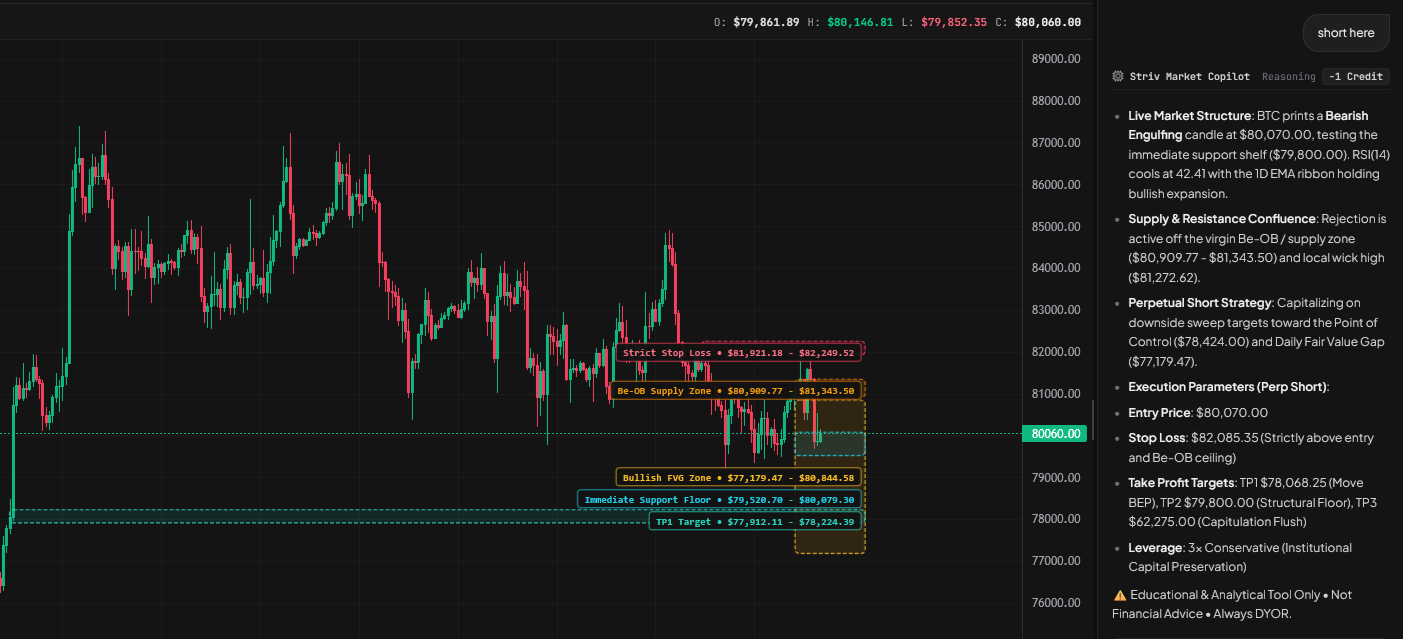
Explore how Copilot connects market structure, open positions, and closed journal entries in a single review. Select an inquiry below to inspect the methodology.
Copilot review walkthrough
Select an inquiry
Worked analysis & ledger math
Win rate hides edge decay when winners get trimmed early and losers take full size plus funding. Copilot pulls fee-adjusted ledger math from your closed book before looking at entry notes.
Workspace context referenced: Closed fills, maker/taker commissions, funding fees, hold duration, and journal notes.
Written examples illustrate the review workflow. Live workspace responses reflect your own portfolio records and prompt context. Striv never executes orders on your behalf.
Open your workspace, organize your spot and futures records, and keep every thesis in view.